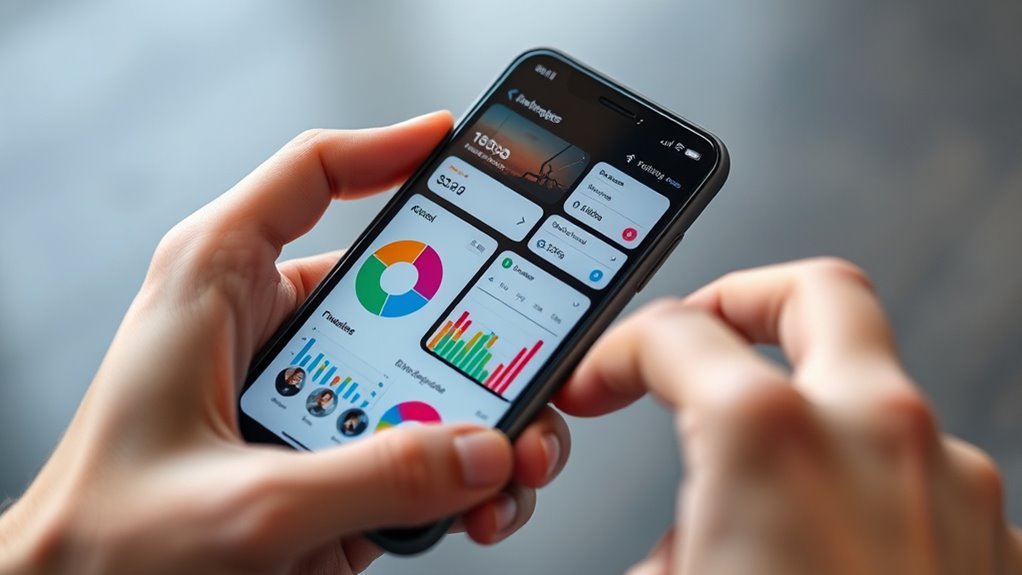

Embedding analytics in everyday apps allows you to see real-time data within tools you already use, making insights instantly accessible and easier to act on. It simplifies understanding complex information by transforming raw data into clear visuals tailored to your goals. This approach keeps you informed without switching platforms, fostering quicker decisions and better team alignment. To discover how integrated data visualization can transform your workflow, explore the key strategies behind seamless analytics integration.
Key Takeaways
- Embedding analytics into familiar apps simplifies data access and enhances user engagement.
- Real-time dashboards provide instant insights, enabling quick response to emerging trends within daily tools.
- Customizable visualizations focus on relevant metrics, making complex data understandable for all users.
- Integrated data visualization fosters a data-driven culture by facilitating immediate decision-making within existing workflows.
- Embedding analytics transforms raw data into strategic assets, boosting operational efficiency and competitive advantage.
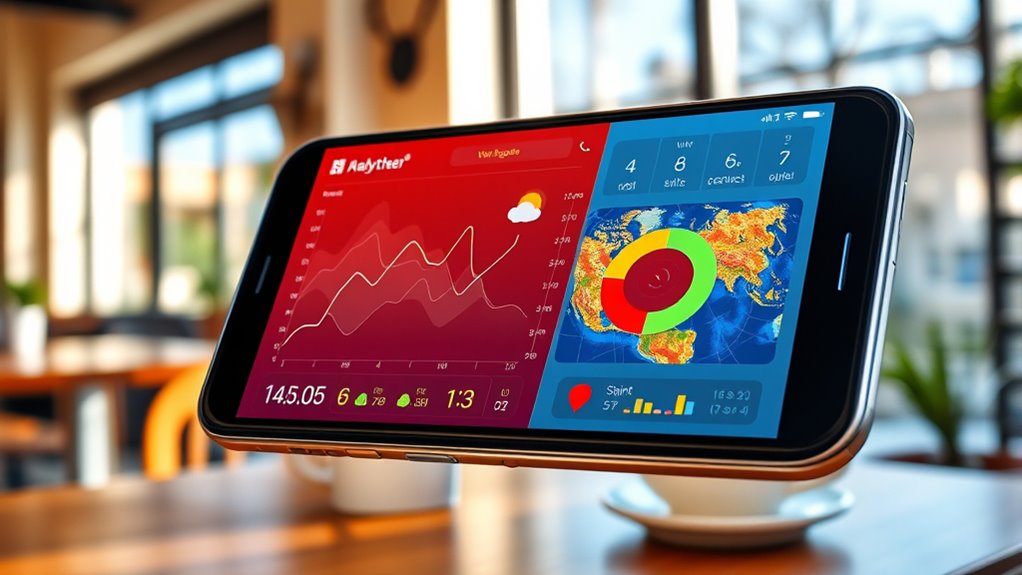
Have you ever struggled to make sense of complex data from multiple sources? If so, you’re not alone. In today’s fast-paced digital environment, simply gathering data isn’t enough; you need to interpret it quickly and effectively. That’s where integrated data visualization comes into play, especially when embedded directly into your everyday apps. It allows you to transform raw numbers into clear, actionable insights without constantly switching between different tools or platforms. When you embed analytics into tools you already use, such as dashboards within your CRM or project management app, you keep everything in one place. This seamless integration not only saves time but also encourages more frequent data review, leading to better decision-making. Real-time dashboards are a *vital* part of this approach because they provide instant updates on key metrics. Instead of waiting hours or days for reports, you see current data at a glance, enabling you to respond swiftly to emerging trends. For example, if user engagement dips unexpectedly on your website, a real-time dashboard can highlight this immediately, prompting you to take corrective action without delay. Embedding such dashboards directly into your platforms fosters a more proactive management style, reducing blind spots and ensuring you stay informed at all times. This continuous visibility helps you identify issues early before they escalate, giving you a competitive edge. Plus, these dashboards are customizable, so you can focus on the metrics most relevant to your goals. Whether it’s monitoring sales, tracking user interactions, or analyzing operational performance, you can tailor the visualization to suit your needs. The beauty of integrated data visualization is that it makes data accessible and digestible, even for those who aren’t data experts. When users see insights within their familiar apps, user engagement naturally increases because it becomes easier to understand and act on the information presented. Instead of feeling overwhelmed by complex spreadsheets or disconnected reports, users can interact with intuitive visuals that explain what’s happening in real time. This immediate access keeps everyone aligned and informed, fostering a culture of data-driven decision-making. As more organizations adopt embedded analytics, they realize that the key is not just collecting data but making it actionable within the flow of daily operations. By embedding real-time dashboards and other visualization tools into your apps, you empower yourself and your team to make smarter, faster decisions. This approach ultimately transforms raw data into a strategic asset that enhances user engagement and drives business success.
Frequently Asked Questions
How Does Embedded Analytics Impact User Privacy?
Embedded analytics can raise privacy concerns because it involves sharing user data within apps, which may expose sensitive information. You need to prioritize data security to safeguard users from breaches or misuse. By implementing strong encryption, access controls, and transparent data policies, you can minimize privacy risks. This way, you ensure that user privacy remains intact while still benefiting from embedded analytics‘ insights.
What Are the Best Tools for Integrating Data Visualization?
If you’re looking to integrate data visualization, consider tools like Tableau for interactive dashboards or D3.js for flexible visualization libraries. For example, a retail app improved customer insights by embedding dashboards that let users explore sales data dynamically. These tools enable seamless integration, making analytics accessible within your apps. They help you deliver engaging visualizations that empower users to make smarter decisions quickly and effortlessly.
How Can Real-Time Data Be Embedded Effectively?
To embed real-time data effectively, you should utilize tools that support live data updates and seamless integration. Incorporate APIs that deliver real-time updates, ensuring your visualizations refresh automatically. Use platforms like Power BI or Tableau with real-time data connectors, and optimize your data pipelines for minimal latency. This approach keeps your app dynamic, providing users with instant insights and up-to-the-second information, enhancing decision-making and user engagement.
What Are Common Challenges Faced During Integration?
You might face challenges like accessibility barriers, which hinder users’ ability to interact with data visualizations effectively. Data security is also a concern, as embedding analytics requires protecting sensitive information. Ensuring seamless integration without compromising user experience or security can be tricky. You need to carefully address these issues by implementing accessible design standards and robust security protocols, making data insights available safely and inclusively within your apps.
How Does Embedded Visualization Improve Decision-Making?
Did you know that companies using embedded visualizations see a 30% faster decision-making process? Embedded visualization enhances your decision-making by improving user experience and enabling effective data storytelling. When insights are seamlessly integrated into daily apps, you access real-time data easily, making complex information clearer. This immediacy helps you act swiftly, ensuring your decisions are informed, confident, and based on an all-encompassing understanding of the data.
Conclusion
Imagine data visualization as the heartbeat of your everyday apps, turning raw numbers into a vibrant symphony that guides your decisions. By embedding analytics seamlessly, you don’t just see the data—you feel it pulse with life, transforming mundane moments into powerful insights. This integration isn’t just technology; it’s your trusted compass, lighting the path through the complex maze of information. Embrace it, and watch your understanding blossom like flowers in spring.