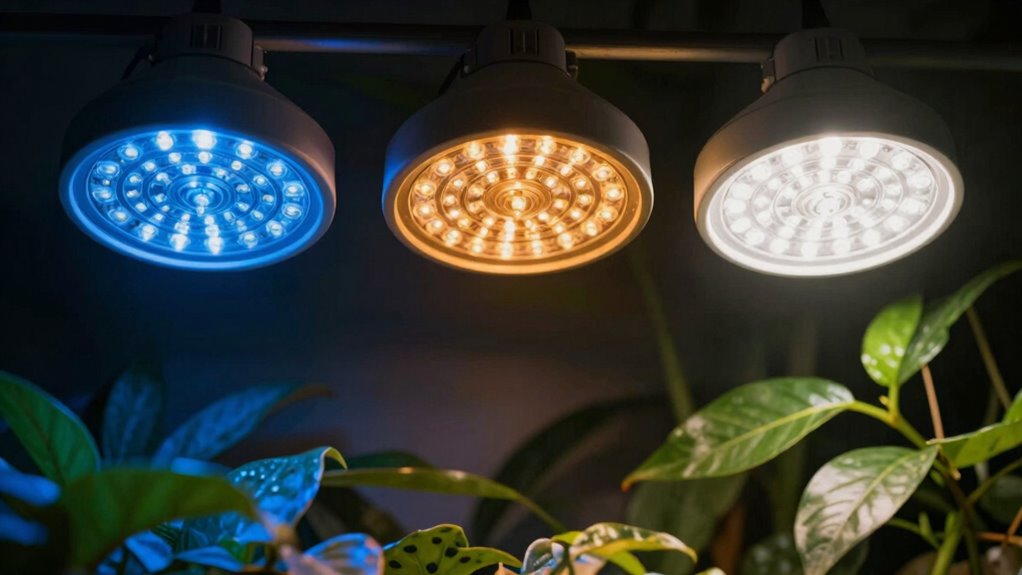
A calm workspace often solves both ergonomics and visual noise issues, creating a comfortable environment that boosts productivity and focus—discover how to achieve it.
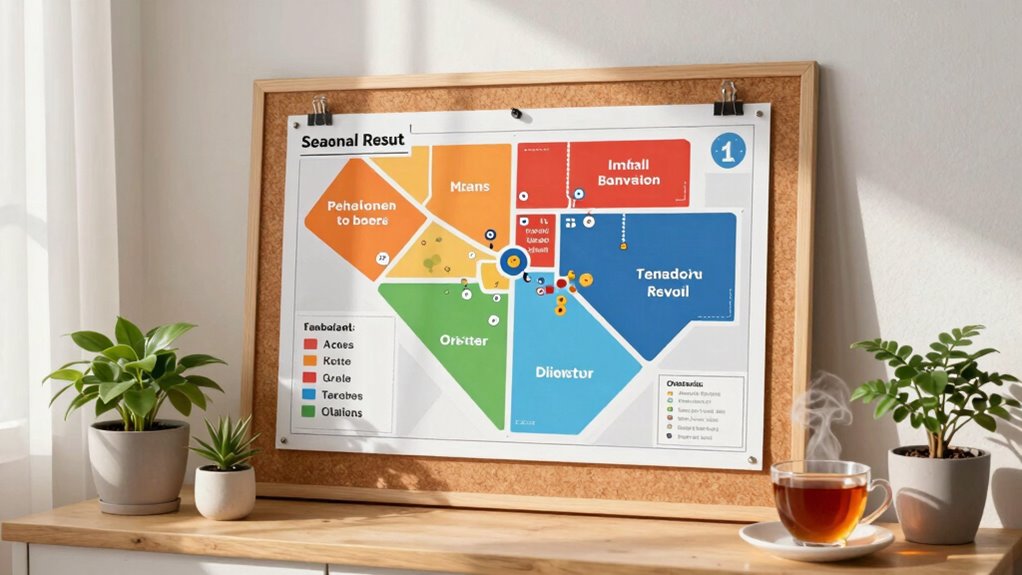
Meant to guide your clutter-clearing journey, the seasonal reset map reveals what to keep and cut—discover how it can transform your space and mindset.
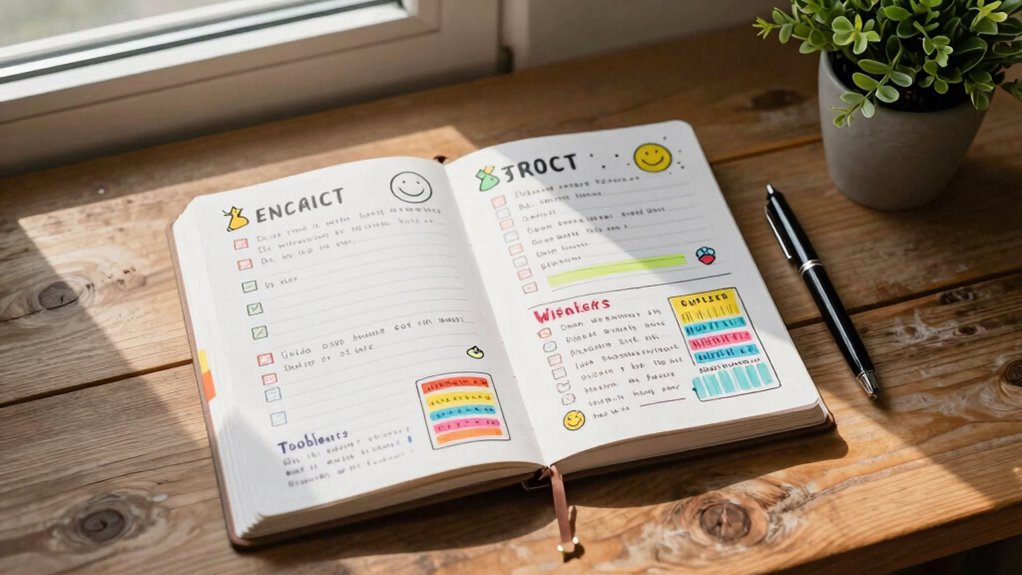
Discover how visual checkpoints in wellness journals can boost motivation and make your journey more rewarding—find out why they work better than you think.
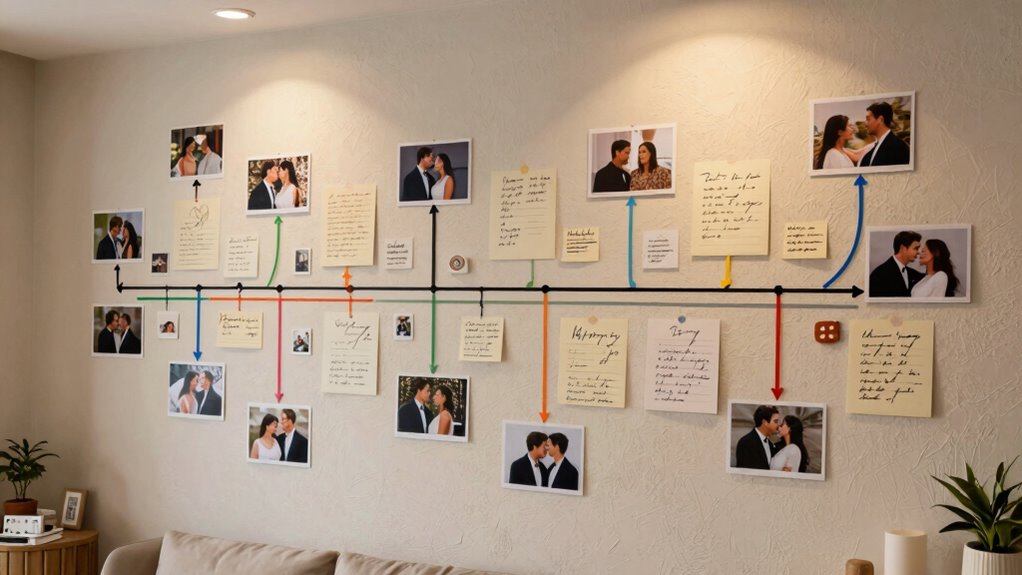
With relationship timeline mapping, uncover hidden patterns that may be affecting your connection—discover what you’ve been missing and take control of your future together.